This page acts as the graphic user interface manual and describes how to set up and use the Peta-pico-Voltron hvps-x GUI.
1. Downloading the graphic user interface & prerequisites
The download page provides the Python source code and a windows executable in separate zip archives. The Python source code can be used on a broad range of platform. We developed the code on a Windows machine, and also tested on OSX 11.7.10. A few hooks were added to iron out a few weird things on OSX, but there might still be some issues. The interface hasn’t been tested on Linux yet. In any case, if you spot a bug, get in touch with us.
The interface is currently not optimised for touch screens and assumes that a keyboard will be available for numerical input (voltage/frequency). If you’d like to use the interface with a touch screen, get in touch and we’ll restore the numerical input keypad (It’s somewhere on the roadmap, but can be pushed forward if there is a need).
Make sure the HV Enable switch (S1) is on position ‘0’. Power the hvps-x with a 13.5V DC power supply and connect the USB cable.
1.1 Using the executable
If running the GUI on a Windows machine, unzip the executable archive and launch the file mainx.exe
Important: Since version 1.2 and owing to a change in how pyinstaller packages the executable, all files (except the main executable) are located in a sub folder named _internal. When the instructions on this manual refer to the root folder of the interface, it means inside this _internal folder if you are using the compiled executable. This is, for example, where you will find the config.ini file to configure the GUI, or where you need to place the waveform.csv file to define a custom waveform.
1.2 Launching from source
For other platforms, or if you want to run from source, install Python 3 (we have tested the GUI with Python 3.9), and then extract the source archive. Open a terminal window in the interface folder and type
python mainx.py
If you have both Python 2 and Python 3 on your machine, you may have to use the command ‘python3’. Some dependencies are required. Please read the install.txt file for more information on how to install them.
2. Launching the graphic user interface
Once you have launched the executable the program window should open.
- If you are running from the source code and you are missing some dependencies, a message indicating you don’t have all the required packages appears. The easiest way to install all required packages is to use the command ‘pip install -r requirements.txt’
- The first time the interface starts, there will be a delay before the windows shows up due to the need to cache some fonts.
- If the GUI doesn’t detect a hvps-x, an error dialog will appear with a message indicating that the GUI cannot connect to a hvps-x. If a hvps-x is connected and this message appears, it is most likely because you did not configure the hvps-x. Refer to this page to perform the initial configuration.
- If the GUI detects more than 1 configured hvps-x, a dialog box with a drop-down list appears with the name of the connected hvps-x select the one you want to use and press OK.

When the GUI opens, most of the controls will be greyed out. This is because the high-voltage enable switch (s1) on the board is on position ‘0’. This is a safe position and there cannot be high-voltage at the hvps-x output while the HV enable switch is in that position (refer to the hardware page). The HV enable switch should always be placed on position ‘0’ when the hvps-x is not actively used. They greyed out buttons are a visual indication of the button state and attract the attention of the user that parameter cannot be changed, as the unit is disabled. Switching the onboard HV enable button to position ‘1’ activates the interface.
3. Using the graphic user interface
The interface is separated into two tabs. A main tab that gives access to the main controls of the power supply, and a waveform tab that lets the user configure the arbitrary output waveform.
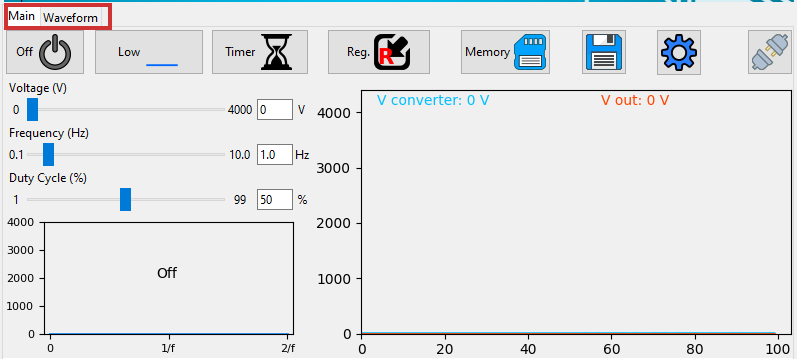
- Main tab: See the Main user interface tab page.
- Waveform tab: See the Custom waveform tab page.
4. GUI configuration
Some of the GUI parameters can be set by editing the file config.ini located in the root folder of the interface. The relevant section for the GUI configuration is the [GUI] section. It is necessary to relaunch the interface after editing the file.
[GUI]
;minimal value of the frequency scale
fmin=0.1
;maximal value of the frequency slider
fmax=10
;resolution of the frequency slider
fres=0.1

;resolution of the voltage slider for the different voltage ratings
vres_6000=50
vres_5000=25
vres_4000=20
vres_3000=10
vres_2000=10
vres_1200=5
vres_500=2

;whether the voltage is set to 0 when starting / leaving the interface. If 0 hvpsx left in current state.
zero=1

;whether the voltage reading graph y scale should be fixed or autoscale
autoscale = 0

;whether to turn trace mode on
trace = 0
;time between trace points in ms
trace_rate = 20
;whether the trace rate is automatically calculated to get 5 waveform periods on screen (if 1, the trace_rate parameter is ignored)
auto_trace_rate = 1

;Default resistor value for calculation of waveform PID coefficients in MOhm
wfm_R = 500
;Default capacitor value for calculation of waveform PID coefficients in nF
wfm_C = 1.0

;If auto_apply_meas_rc = 1, when the user presses the 'Meas R&C' button, the hvps-x will sense the resistance and capacitance value AND directly
;calculate and send the resulting PID values to the hvps-x. This combines pressing on 'Meas R&C' and 'Calc PID & Upload' into a single
;operation. If auto_apply_meas_rc = 0, when the user presses the 'Meas R&C'button, the hvps-x will sense the resistance and capacitance value.
;The user must then press on the 'Calc PID & Upload' button to calculate the PID coefficients and upload them to the hvps-x

auto_apply_meas_rc = 1
- The first 3 parameters define the bounds of the frequency slider and its incrementation value. You can change it to include the range of frequencies you usually work with.
- vres_XXXX defines the incrementation of the voltage slider depending on the voltage rating of the hvps-x connected to the interface.
- zero(*): zero=1: the interface will force the voltage set point to 0 and the switching mode to off when it is launched and closed. If zero=0, the interface will not change the voltage setpoint and switching mode when it is launched. We recommend to leave zero=1 for increase safety (avoid voltage being present at the output unless manually done through the interface).
- autoscale(*): if set to 1, the voltage reading graph (8) autoscales its y axis and adapts it to the range of voltage it needs to display. If set to 0, the graph will have a y scale between 0V and the maximal voltage of the hvps-x.
- trace(*): trace=0 is the normal logging mode of the voltage reading graph (8) with 1 point every 500 ms. trace=1 turns on trace mode, with a used-defined sampling time (see trace mode section below)
- trace_rate(*): sampling period in ms (only used when trace=1) (and yes, the name of the parameter says rate, but the value is in ms, go figure!)
- auto_trace_rate(*): if auto_trace_rate=1, the trace_rate_parameter is ignored and automatically calculated based on the switching frequency to display 4 periods of the signal on the screen.
- wfm_R and wfm_C (*): They are the default values displayed on the waveform tab for the load resistance and capacitance.
- auto_apply_meas_rc: If one, pressing the ‘Meas R&C’ button on the waveform interface measures the capacitance and resistance of the load, calculates appropriate PID coefficients, and upload these coefficients to the hvps-x
(*) These parameters can be changed in the GUI in the Options dialog box. The values used in the config.ini files are the GUI’s default values at start-up.
5. Keyboard shortcuts

The image above shows the keyboard shortcuts of the graphic user interface. Additional shortcuts will be added in a future version.
- m: show the main tab of the UI
- w: show the waveform tab of the UI
- <shift>: toggle the switching mode on/off.
- o: open the options/settings dialogue box
- q: quit
- s: change the switching mode
The shortcuts are active on both tabs, even if the underlying buttons are not visible: in the waveform tab, you can for example press <shift> to toggle the output, or ‘q’ to quit the interface, even though the on/off or quit button are not visible on the waveform tab.