The release of hvps-x means the end of development and support for the original SHVPS described on this page. The files and instructions remain accessible, but we won’t provide upgrades or support. The reason for stopping support is that we don’t have any SHVPS left to work on, nor any LabVIEW license to work on the user interface. If you want to assemble a high voltage power supply, we recommend our new hvps-x.
Back to the HVPS User Interface
Although the HVPS is designed to output a DC signal, or a square signal with rapid transitions, it can also output user-defined periodic waveforms. This is an experimental feature which goes beyond what the HVPS has been designed for, but it can be useful to some users. Outputting a custom waveform is done by acting on the high voltage DC-DC converter and is therefore limited in frequency (works best at 1Hz and below).
1 Defining the Waveform
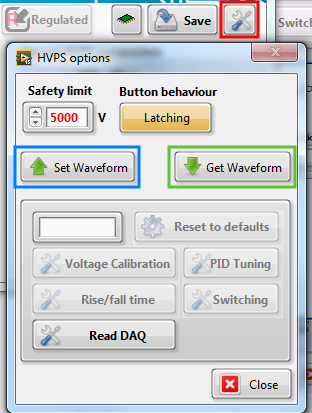
To define a new waveform, open the HVPS options dialogue box from the main window (red square). Press on the Set Waveform button (blue rectangle).
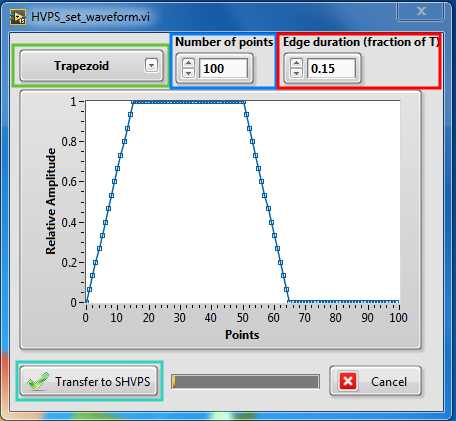
The drop-down list (green square) allows choosing between predefined waveforms (Trapezoid, Triangle, or sine-like) or a user-defined waveform. For each of these waveforms, you can choose if you want the waveform itself, or its square root. In case the HVPS is used to drive a DEA, and using a simple quadratic approximation between voltage and strain, this allows you to decide if the profile should apply to the voltage, or to the strain. For example, if you want a triangular strain profile with respect to time, you should select triangle sq root as input shape.
When you select a waveform (or change any of the other parameters), you see the resulting waveform displayed on the graph. The waveform is relative both in amplitude and time. The amplitude of the waveform is defined by the voltage set point that you define in the interface (i.e. if you have 1000 volts as your voltage set point, then the actual output will be 1000V multiplied by the relative amplitude of the waveform. For the time, the graph shows one period, and the waveform will be repeated at the frequency defined in the interface.
The number of points control (blue rectangle) allows you to define how many points are used to create the waveform. The maximum is 255. If you intend to work at very low frequencies (0.1 Hz or below), use 255. At higher frequencies, you may need to reduce the number of points so that the HVPS can keep up.
The edge duration control (red rectangle) is used only for the trapezoid waveform and enables to define the slope of the raising/falling edge. The duration of the edges is defined as a fraction of period. A value of 0.5 is the maximum, and is equivalent to a triangle signal. A value of 0 is equivalent to a square signal, and should not be used: use the switching mode to obtain a square wave. Indeed the switching mode uses the HV switch based on optocouplers to toggle the state of the output, which can be done very fast, whereas the waveform mode uses the EMCO DC/DC converter, which is very slow.
If you want an output profile that is different from the 3 provided signals, you can define your own waveform. You need to create/edit the file waveform.txt located in the application support folder. The file simply consists of one number per line. Each number is between 0 and 1 to represent 0 to 100% of the voltage set point. You can have up to 255 lines (i.e. points), and they should represent one period of your signal.
Once you have set the parameters, you can transfer the data points to the HVPS (cyan rectangle).
2 Turning on the waveform mode
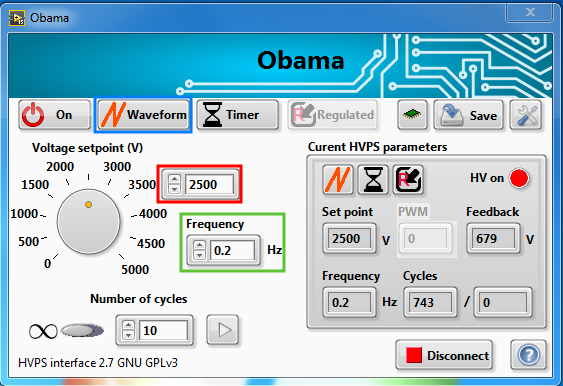
To use the SHVPS in waveform mode, simply press the switching mode button (blue rectangle) until you are in waveform mode (orange sawtooth with text Waveform). You can set the amplitude of the waveform with the voltage set point (red rectangle), and its frequency with the frequency control (green rectangle). As in the standard switching mode, you can either have an unlimited number of cycles, or stop automatically after a defined number of waveform periods.
3 Checking the Waveform
You can use this function for two purposes: 1) Check what waveform is currently stored into the HVPS and 2) check what is the actual output profile of the waveform. The second point is especially important because there can be differences between the defined waveform and the true output, especially if working at frequencies above 1 Hz.
To check the waveform, access the HVPS options dialog (red square), and press the Get Waveform button (green rectangle).

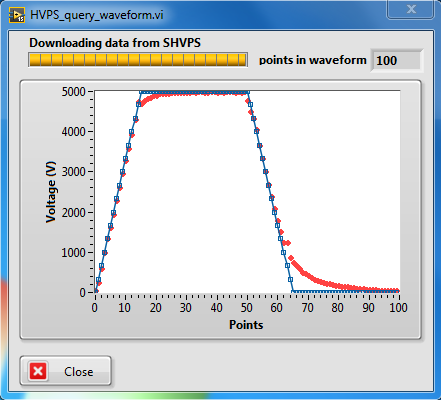
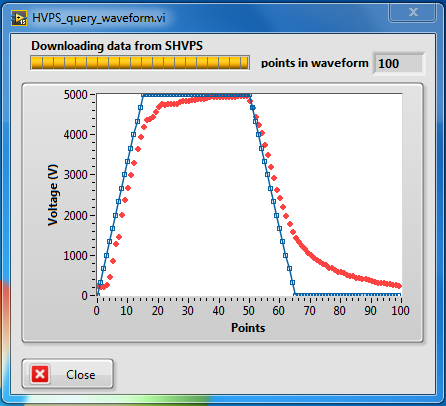
The data will be downloaded from the SHVPS and displayed. The blue points are the waveform set points, while the red points are the actual output of the HVPS. To get meaningful values for the actual output, the HVPS must have run in waveform mode for at least one cycle at a voltage set point higher than 0. In the examples below, it can be seen that the waveform is quite well reproduced for a driving frequency of 0.2 Hz, but at 0.5 Hz, one sees a larger distortion. In particular, the EMCO is slow at decreasing its voltage output.
4 Saving the waveform
If you change the waveform of a SHVPS, it will revert back to the previous waveform once you switch the unit off. If you want to memorize the waveform in the SVHPS non-volatile memory, you need to use the save function. See the page about using the HVPS without a computer for more information on how to save the HVPS current parameters into the non-volatile memory.